More powerful features are available on the client
Global Web3 Market Analysis Tool leader
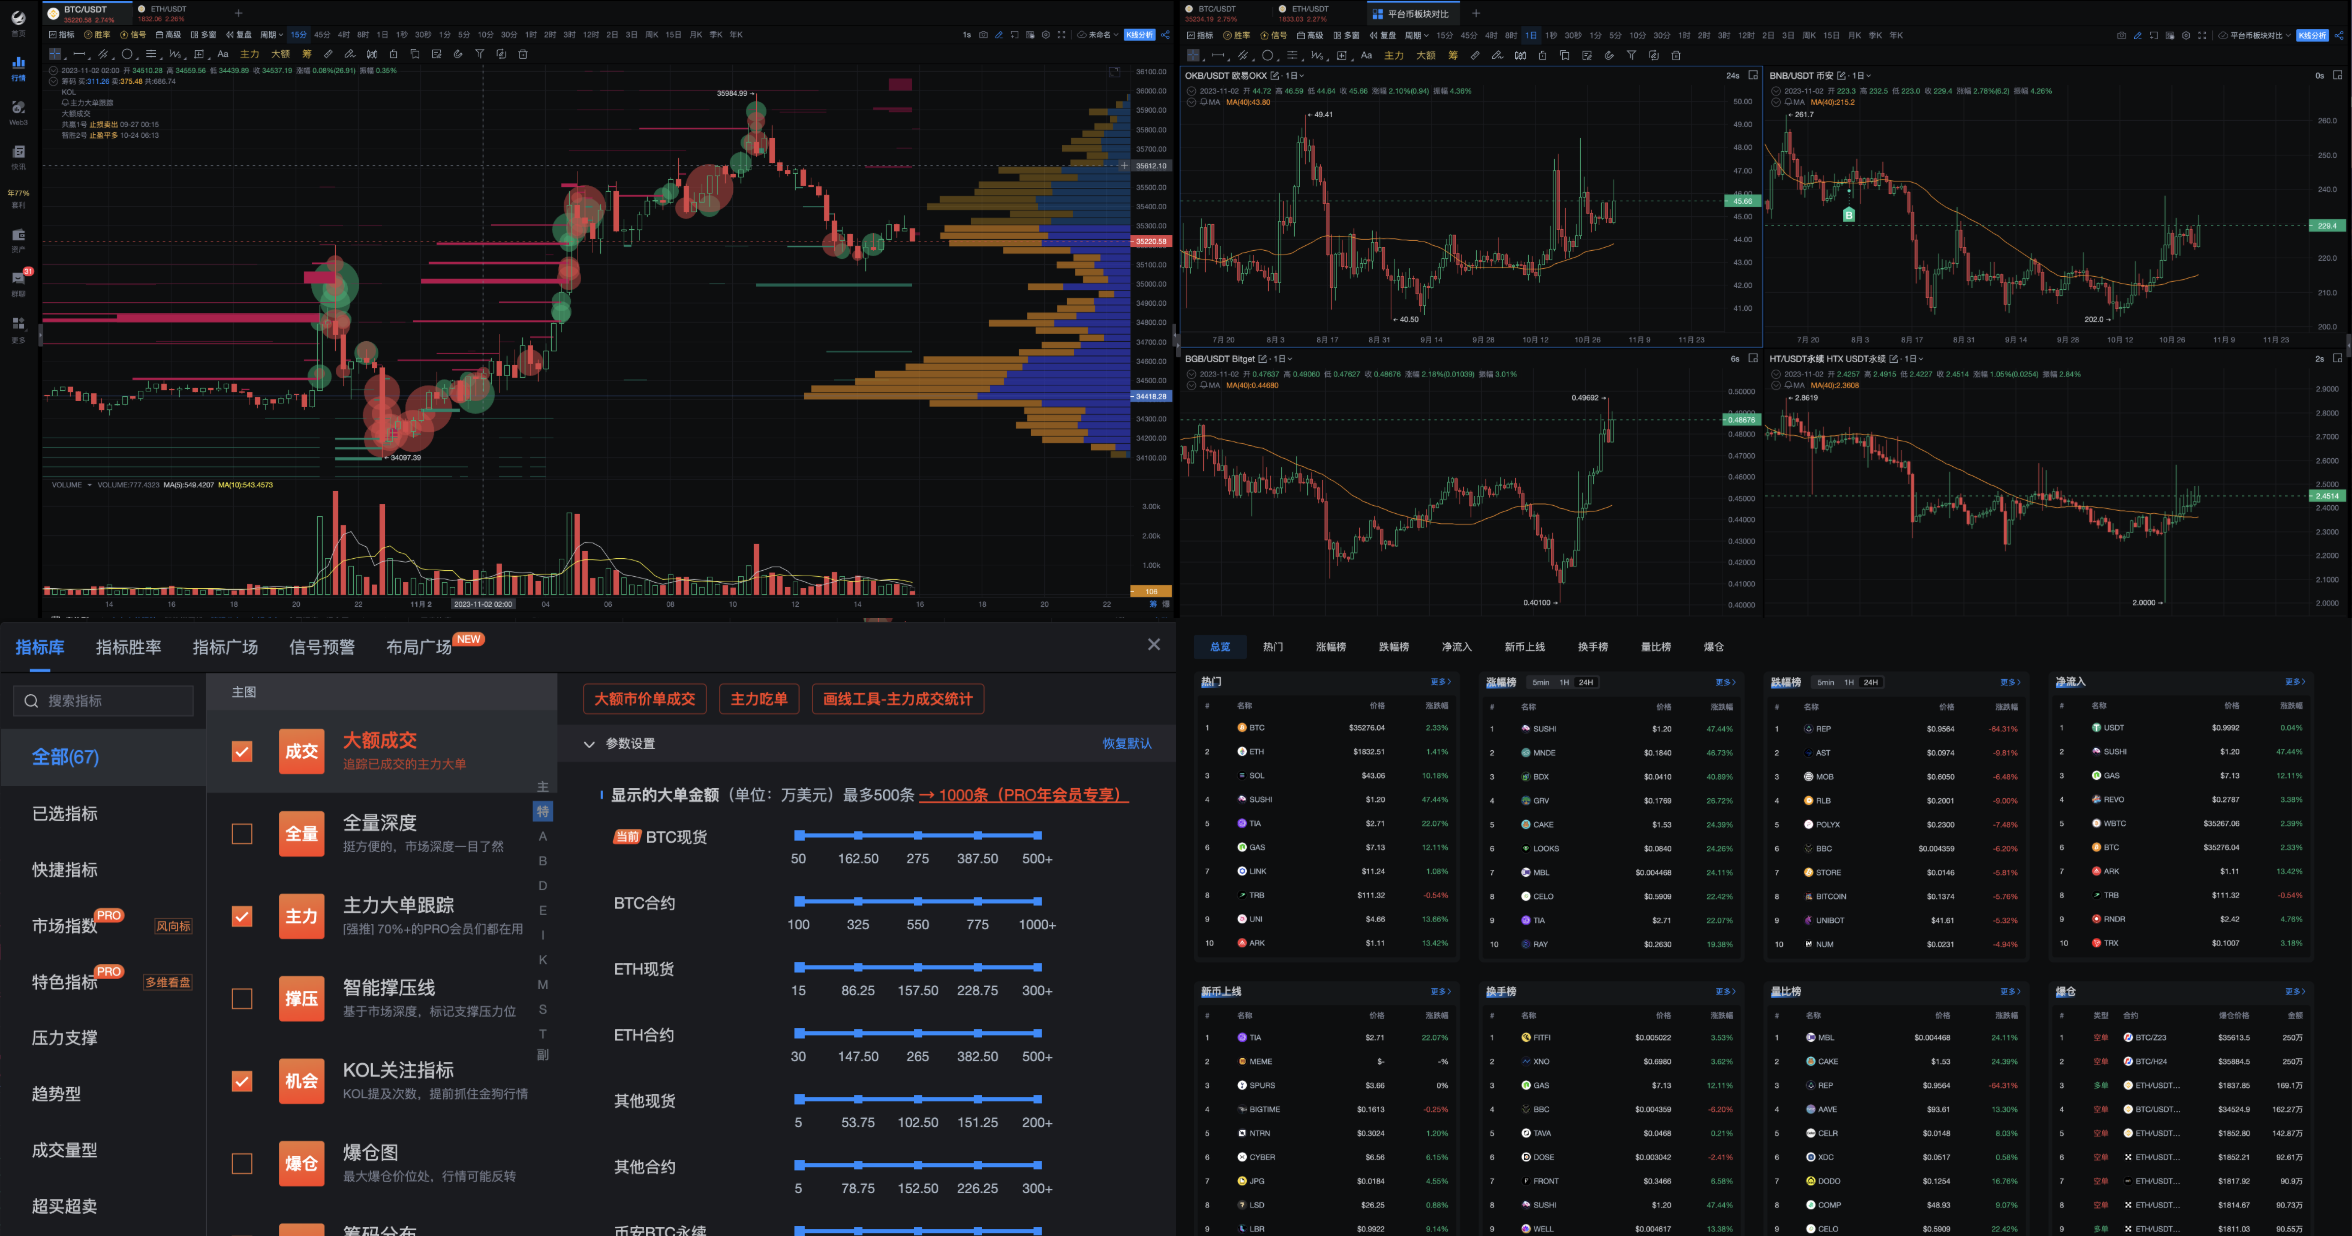
Powerful K-line chart function, programmable custom indicator tools, 35+ exchange market data, multiple warnings, social media news, whale and large order tracking

For value, more efficient
Web3 Toolbox Explores More Possibilities
AICoin’s useful features
Our Market data service gives you an at-a-glance view of the market dynamics, providing you with in-depth market insights in every dimension. Track the main orders, see through the flow of funds to the sector to gain insight into industry trends, and the index to grasp the pulse of the market, just to make your decision-making more scientific
Download Now-
Featured lists
The spot data list of 13 featured contracts makes it easier to select coins
-
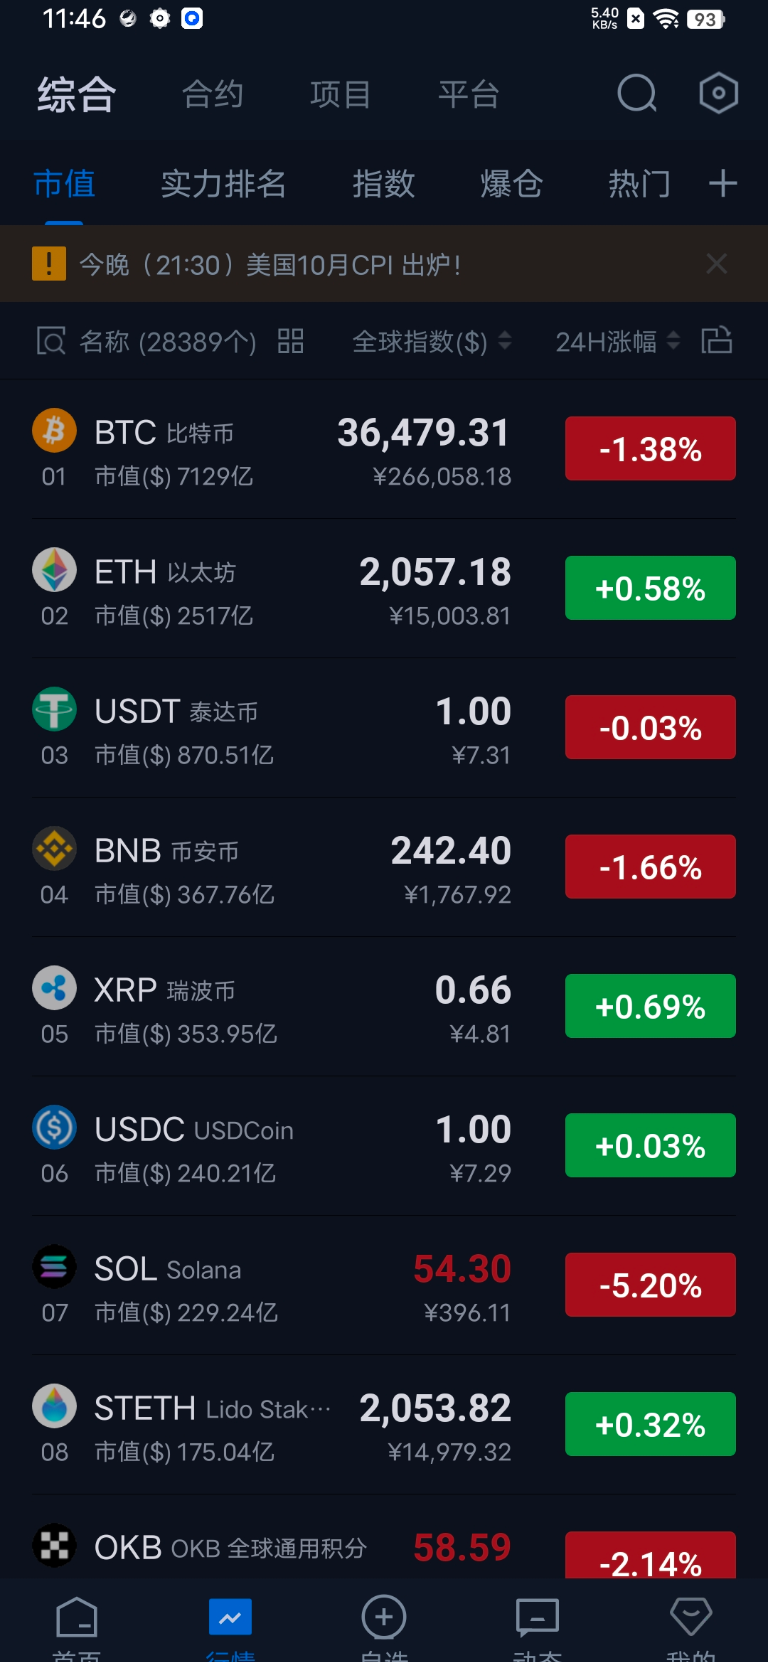
Market Cap排行
全币种总Market Cap排行
-
The main big order For
View large trade orders for the main funds.
-
plate
View the performance of different industry sectors and conduct industry analysis.
-
Optional
Choose the trading pairs you want to focus on, and easily grasp important market information.
-
Manage groups Optional
Edit and manage existing custom groups and adjust them according to your needs.
-
platform
View the data of different trading platforms for comparative analysis.
-
Indices of all kinds
Look at market indices to see how the market is moving in general.
-
PC Home See more exciting ......
AI intelligent interpretation
All you need is a K-line diagram
AI-powered interpretation of reports
Interpretation time: 01/05 16:54
AI's 1-hour price trend is up
Buying and selling points at a premium
Buy point 1: 1.16000
This price is located in the near-term support zone, and the EMA (7) provides additional support around itBuy point 2: 1.10000
If there is a pullback in the market, this level is a strong psychological support level and a low-point area in the previous volatilityLong Stop Loss: 1.08000
Leave enough room to avoid a small movement triggering a stop loss, taking into account the lowest price in the last few hours |- K-line trend interpretation
- Provide the best time to buy and sell
- Multi-indicator prediction to place an order
- Position management


